
Core Web Vitals Explained: What to Measure and Why SEO Cares
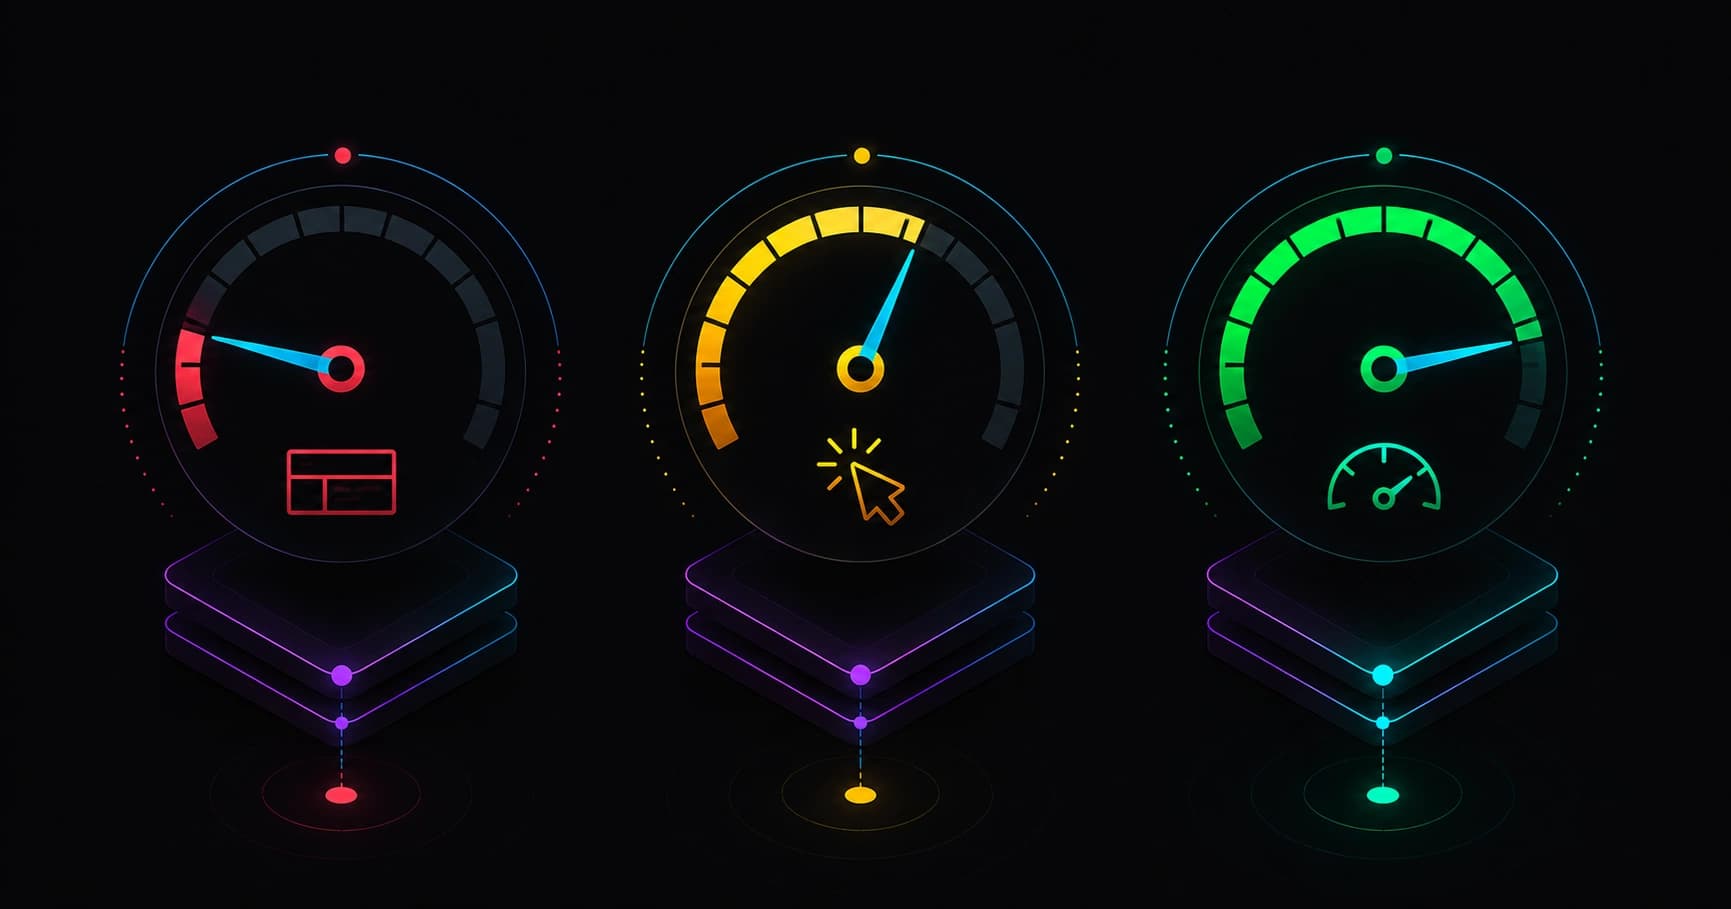
Google does not only measure keywords — it also cares about how fast and stable your site feels to visitors. That is where Core Web Vitals come in: three metrics that summarize loading, interactivity, and visual stability. If your site fails on mobile, you can lose rankings even when content is strong.
This guide explains what they mean, which thresholds Google uses, and what to measure first — without assuming you are a performance engineer.
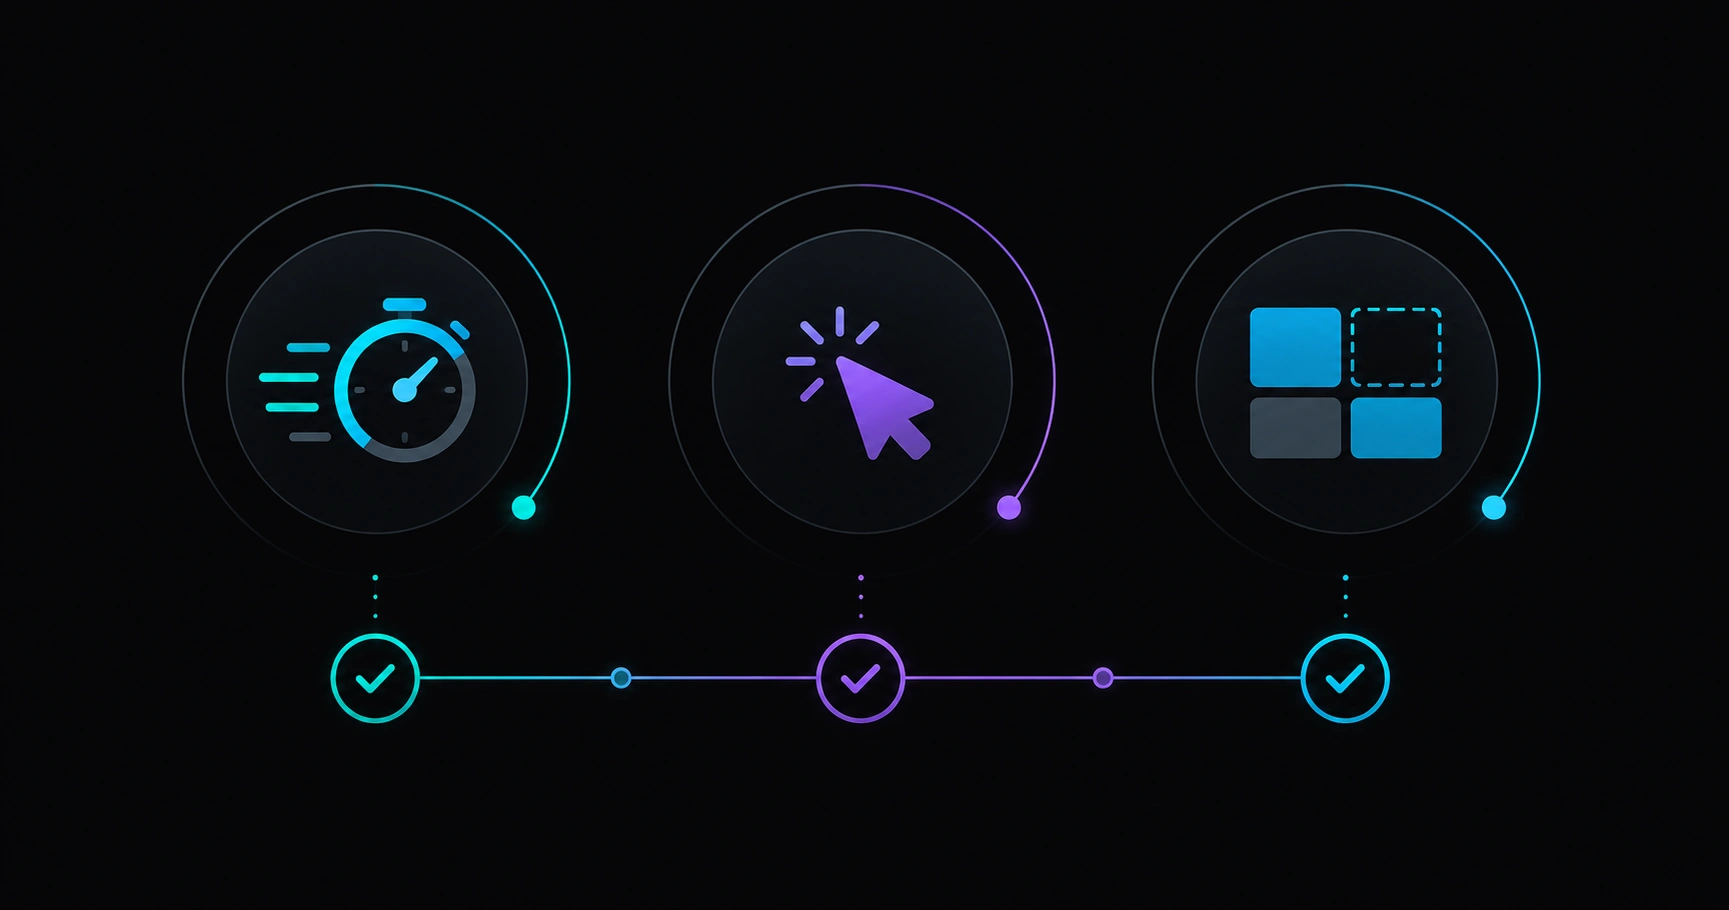
Table of contents
- What Core Web Vitals are
- The three metrics: LCP, INP, and CLS
- Why they matter for SEO
- Thresholds: good, needs improvement, poor
- What to measure first (and where to look)
- Common causes of poor scores
- Quick checklist before asking for help
- Common myths
- FAQ
What Core Web Vitals are
Core Web Vitals (CWV) are a set of web performance metrics Google uses to evaluate page experience. They do not replace good content or sound technical foundations, but they can influence rankings when two pages compete for the same search intent.
Since 2021 they have been part of page experience signals. In practice, most teams track them because:
- They reflect what users experience on mobile — where most traffic happens.
- They can be measured with free tools (PageSpeed Insights, Search Console).
- Fixing them often improves conversions and bounce rate, not just SEO.
The three metrics: LCP, INP, and CLS
LCP — Largest Contentful Paint (loading)
Measures how long until the main content block appears: a hero, a large image, or a prominent headline. If visitors stare at a blank screen too long, LCP suffers. It is the most visible metric for people arriving from search.
INP — Interaction to Next Paint (responsiveness)
Largely replaced the older FID metric. It measures latency when users interact: clicking a button, opening a menu, submitting a form. A site that feels sluggish on tap often has high INP even when LCP looks fine.
CLS — Cumulative Layout Shift (visual stability)
Counts how much the layout jumps while loading: a banner pushing text, a font resizing, an ad shifting the buy button. It frustrates users and hurts perceived quality.
For priority order from a technical team perspective, see our guide on SEO for developers: what to measure first.
Why they matter for SEO
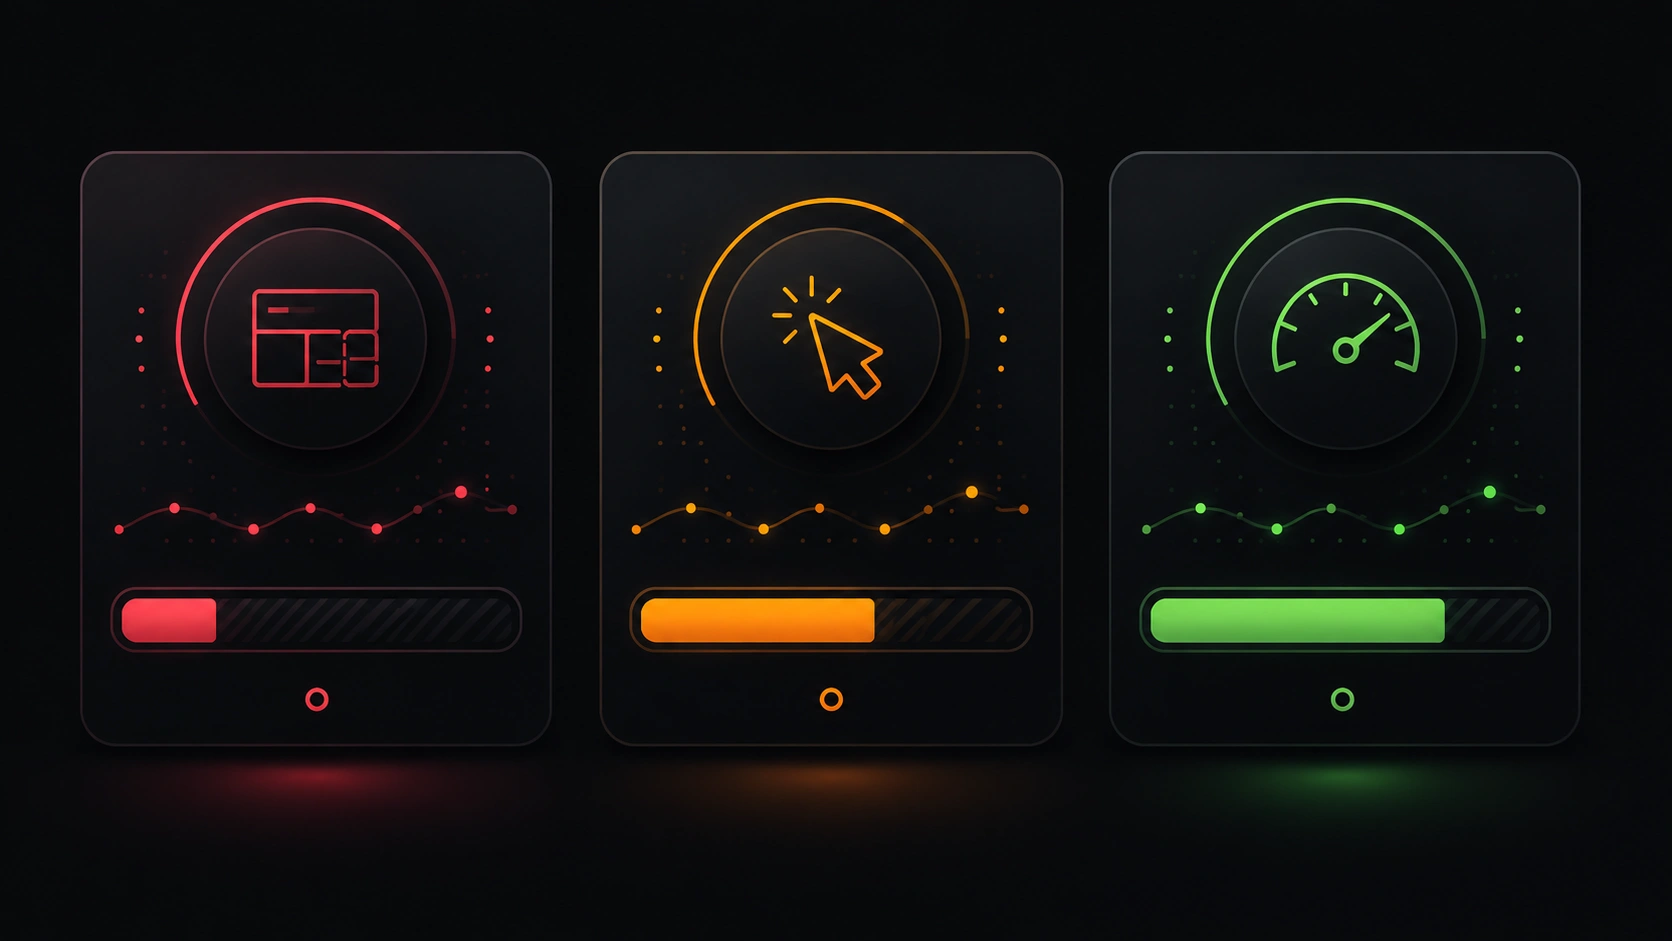
Google has repeated that helpful content comes first. Still, CWV act as a tiebreaker: between two relevant URLs, the faster and more stable one has an edge. Also:
- More efficient crawling: slow pages consume crawl budget; Google may index fewer URLs on your domain.
- Indirect CTR benefits: a smooth site retains users longer; positive engagement reinforces visibility over time.
- Mobile-first alignment: Google primarily indexes the mobile version; CWV are evaluated largely on real devices.
Speed optimization is not a Google hack — it aligns product, UX, and SEO. Well-built modern frontends (including headless setups done right) can make good CWV easier, but architecture alone fails if images weigh megabytes or the server responds slowly.
Thresholds: good, needs improvement, poor
Google publishes reference ranges (they can change; always check official docs). Practical summary:
| Metric | Good | Needs improvement | Poor |
|---|---|---|---|
| LCP | ≤ 2.5 s | 2.5 – 4.0 s | > 4.0 s |
| INP | ≤ 200 ms | 200 – 500 ms | > 500 ms |
| CLS | ≤ 0.1 | 0.1 – 0.25 | > 0.25 |
Search Console groups URLs into Good, Needs improvement, and Poor based on field data (real Chrome users). PageSpeed Insights blends lab and field data — useful for diagnosis, but they do not always match perfectly.
What to measure first (and where to look)
- Home and conversion landings — they usually get the most search traffic and clicks.
- Product or service templates — one template issue affects hundreds of URLs.
- Mobile version — prioritize mobile even if analytics show desktop converts more.
Common tools (without diving into setup):
- Google Search Console → Experience report → Core Web Vitals.
- PageSpeed Insights — single URL, recommendations per metric.
- Lighthouse in the browser — quick lab diagnosis (great during development).
For the full measurement toolkit, see our SEO DevTools guide for developers.
Common causes of poor scores
High LCP
- Uncompressed hero images or oversized resolutions.
- Slow server or missing cache (high TTFB).
- Fonts or scripts blocking initial render.
High INP
- Heavy JavaScript on the main page.
- Third-party widgets (chat, analytics, maps) competing on the main thread.
- Forms or filters that recalculate too much on interaction.
High CLS
- Images or videos without reserved space (width/height).
- Banners or pop-ups inserting content above the fold.
- Web fonts that change text size when they load.
Most causes are cross-platform: whether you run classic WordPress, a headless CMS, or a modern framework — diagnosis starts with measuring and prioritizing.
Quick checklist before asking for help
- Do you have the CWV report in Search Console without mass crawl errors?
- Have you tested home and main landing in PageSpeed (mobile)?
- Does the issue affect one URL or an entire template?
- Do field data (real users) confirm what you see in the lab?
- Have you noted what changed on the site before metrics worsened?
If you are still in the red after this, a prioritized technical audit beats a generic quick fix.
Common myths
“A 100 Lighthouse score means top rankings”
Lighthouse is lab data. Google also uses field data. You can score 100 locally and still show Needs improvement in Search Console.
“Hosting alone fixes CWV”
Good hosting helps LCP, but images, scripts, and design matter equally. Upgrading plans without measuring is often expensive and ineffective.
“CWV only matter for e-commerce”
Any site competing in search benefits: blogs, B2B landings, corporate sites.
“A cache plugin fixes everything”
Cache mitigates TTFB and HTML but does not fix CLS from layout or INP from excessive JavaScript.
FAQ
How long until Core Web Vitals improve after optimization?
Field data in Search Console updates on roughly 28-day cycles. After deploying fixes, allow at least a month for a stable trend.
What is the difference between field and lab data?
Field: real users, varied networks and devices — what Google uses for ranking CWV. Lab: controlled simulation — great for debugging, not always representative of your audience.
Should I optimize desktop or mobile first?
Mobile. It is the primary reference for mobile-first indexing and where the worst LCP and INP often appear.
Do Core Web Vitals replace content?
No. A fast site with weak content does not rank. Secure indexing and relevance first; then tune CWV to win the tiebreaker.
Want to know how your Core Web Vitals look?
Veloce Devs offers a free PageSpeed and technical SEO audit: LCP, INP, CLS, and a prioritized action plan for your site.